Where Does the GDP Go? Impoverished U.S. States Rank Higher Than Major Countries
West Virginia is one of the poorest states in the nation. Yet the mountaineer state has a gross domestic product (GDP) per capita that rivals major European countries like France.
In 2019, France had a GDP per capita of €36,144, or approximately $41,204 in 2019 dollars. For West Virginia, it was $47,848.
In general, U.S. states regularly rank above most major countries in terms of GDP per capita. The top 50 largest regions by GDP per capita only lists 17 countries, a number of which are wealthy micronations like Monoco, Lichtenstein, and Luxembourg. The rest are American states.
Mississippi, the poorest U.S. state, ranks higher than major industrial powers like Japan, Italy, and Spain.
Data on states comes from the Bureau of Economic Analysis (BEA) and Truth in Accounting. International data is from the World Bank, Convention on the Organisation for Economic Co-operation and Development (OECD), and the Allianz Global Wealth Report.
Despite the high GDP compared to their population size, many of these states are considered poor. For others, like Connecticut, Illinois, and New Jersey, the state government itself is financially in the red. They consistently need to borrow to make pension obligations and balance the budget.
Essentially, high GDP doesn’t translate to prosperity or a balanced budget.
When looking at other metrics of wealth, like the state government’s net assets per capita—assets minus liabilities per population—most U.S. states disappear from the rankings. With a few exceptions, only low population, natural resource industry states like Alaska, Wyoming, and North Dakota rank alongside major economic countries like France, Germany, Denmark, and Japan.
While the U.S.—that is, the federal government—easily ranks first in the world in terms of net assets, the combined net assets per capita of all 50 state governments is effectively zero. The poor states cancel out the wealth of the richer ones. The average U.S. state ranks somewhere below Ukraine and Indonesia.
Why GDP Doesn’t Translate To Higher Wealth
With such a high GDP, one would assume that might translate into general prosperity. But GDP is largely measured by personal expenditures. Of the major components of GDP—government spending, business investment, net exports, and personal consumption—personal consumption expenditures comprise 60 to 70 percent of the total. In that sense, GDP is not the best gauge of wealth.
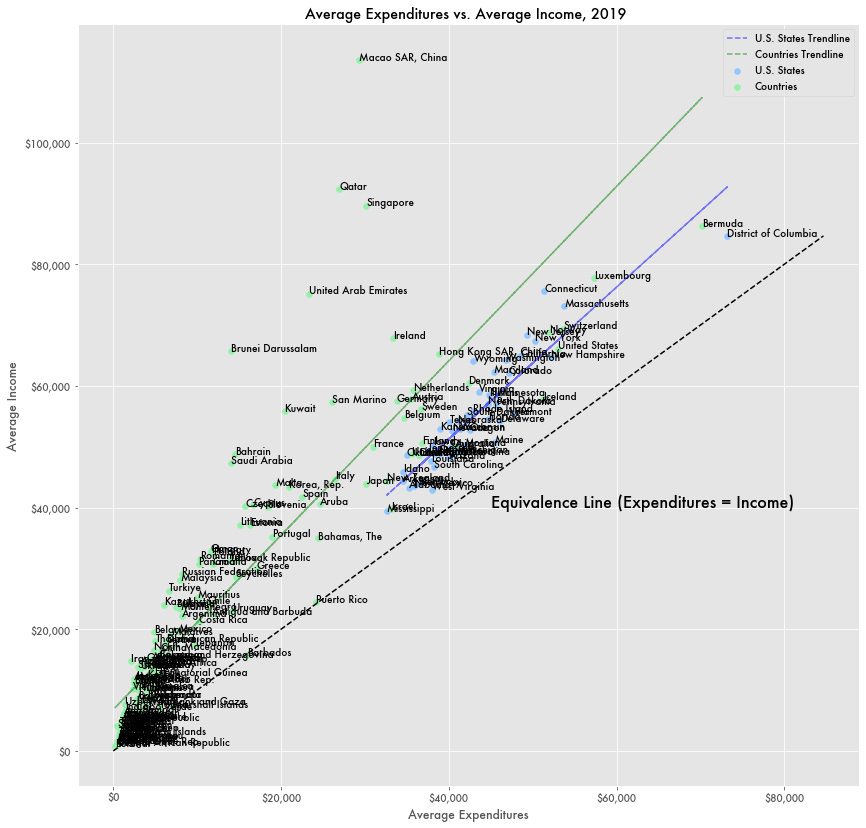
While average income in U.S. states is competitive with other major economies, average personal expenditures are higher. In the case of France and West Virginia, the average income in France was slightly over $50,000 in 2019. In West Virginia, it was $43,000. Yet average expenditures in France were $31,000, and in West Virginia it was $38,000.
Or in short: the average French citizen makes more and the average West Virginian spends more.
In terms of average net profit—gross income minus gross expenditures—the average Frenchman makes four times that of the West Virginian—$20,000 vs. $5,000.
And that trend appears to continue across U.S. states overall. Residents in U.S. states tend to spend more relative to their income compared with other countries.
For example, Massachusetts has an average income similar to that of the United Arab Emirates, but the average expenditures per person in Massachusetts are substantially higher than the oil rich nation.


