The Spurious Correlations' Missing Data
'Correlation does not imply causation' is an old adage of science and formal logic. It's a gentle reminder that sometimes, when two distinct events happen in sync, it can also simply be coincidence.
Around 2013, a website called Spurious Correlations dedicated to this adage was created by Tyler Vigen, a then-Harvard Law Student. The site attracted considerable attention and popularity leading to a book published by Hachette in 2015 by the same name. The site and the book list comical correlations, such as how movies starring Nicholas Cage correlate to pool drownings or how spending on space and science technology correlates with suicides by hanging.
A number of the data sets used to derive the charts on the site are no longer available, but archives show that some of the data used was not right and some of the correlations were overly simplified interpretations of correlation. Statistical agencies can modify historical data over time, although this analysis attempts to use the archival data when possible.
For example, the correlation between margarine consumption and the divorce rate in Maine shows a very highly correlated association over 10 years of data (Pearson correlation: .99 out of 1). U.S. Census archival data linked to from the site on Maine divorce rate no longer exists. Archived versions of the data show no data for 2001 to 2004. For the data available after 2004, the data is not substantially correlated (Pearson correlation: .61).
A correlation between non-commercial space launches and doctorates in sociology shows a unique correlation on somewhat volatile data (Pearson correlation: .79). The archival data on doctorates from the National Science Foundation (NSF) is no longer available, although data from the American Sociological Association (ASA), compiled from the same data source shows a weaker correlation (Pearson correlation: .69). The NSF publishes more recent data since 2010, but that data has almost no correlation with the data on non-commercial space launches (Pearson correlation: .21).
Another correlation between Japanese cars sold in the U.S. and suicides by crashing of a motor vehicle is based on data that is still available at both the Bureau of Transportation Statistics (BTS) and the Centers for Disease Control. But the data on Japanese car sales by the BTS might be far off. In a press release from 2009, Toyota lists around 1.5 million cars sold in the U.S. The BTS data lists 829 thousand: a substantial discrepancy that may be a remnant of the inaccuracy of the underlying source data.
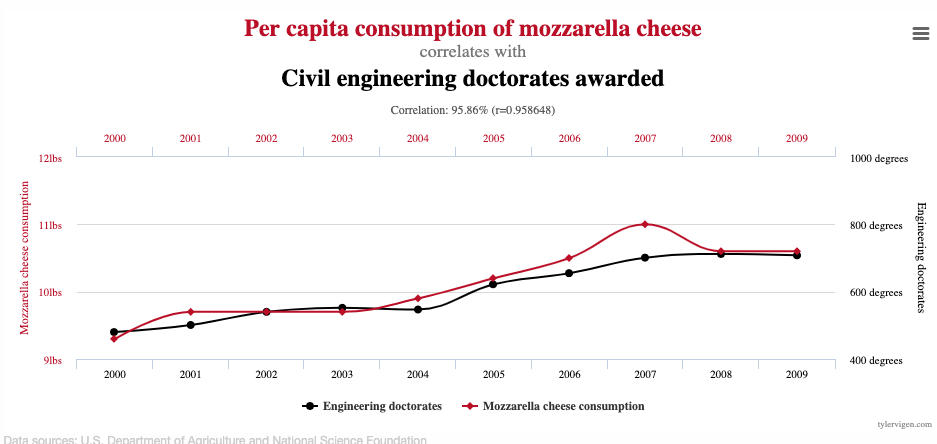
Other charts on the site are simply facile correlations also based on data that may no longer be accurate. Spending on science, space, and technology has trended upwards from 1999 to 2009 along with suicides by hanging. The same goes for mozzarella consumption versus civil engineering doctorates.
The source for mozzarella consumption has disappeared and more recent USDA data lists average per capita consumption at 1/3rd of a pound less each year than what was published on the Spurious Correlations site.
U.S. spending on science, space, and technology also far exceeds the amounts listed on the Spurious Correlations site. Archived data from the Census lists over $372 billion spent on science, space, and technology in 2007, far more than the $25 billion shown.
Many things trend upwards over time, sometimes with large scale events, such as population growth. Correlations on non-dynamic or stable data, such as constant values or constant slopes—especially on small data sets, like 10 points in a decade, are a simplistic interpretation of correlation analysis.
While correlation does not always imply causation, the probability of finding a correlation on unrelated, complex data is generally low.


