Michael Mann's Hockey Stick Graph Shouldn't Show The Mid-Century Temperature Decline
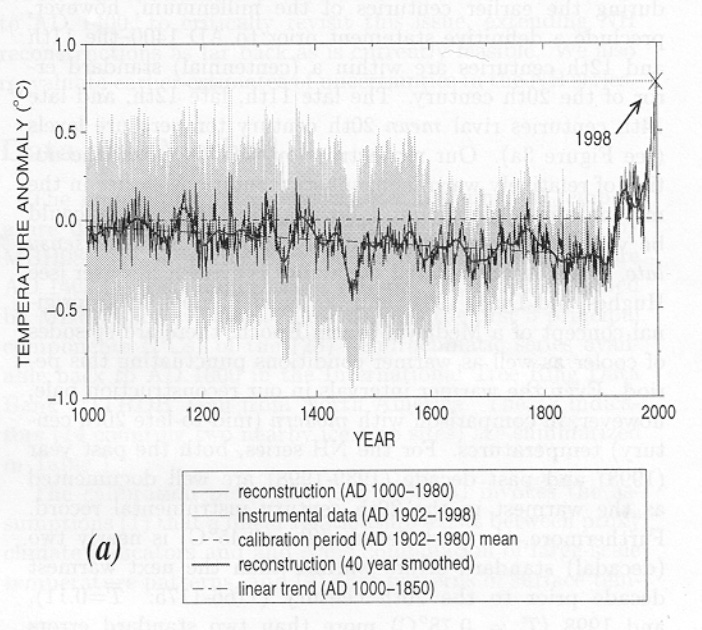
The infamous “hockey stick” chart is an image produced by climatologists Michael Mann, Raymond Bradley, and Malcolm Hughes in 1999 showing the sharp upswing in atmospheric temperature in the 20th century compared to prior eras. It was prima facie evidence that current era temperatures aren’t just slightly anomalous but far outside the norm.
It was the main focus of Al Gore’s documentary, An Inconvenient Truth, which drummed up significant attention to the issue of the greenhouse effect and climate change.
As there is no single dataset connecting current measurements of air temperature with estimates of temperature from prior centuries based on ice core and tree ring data, Mann et. al’s data is based on a statistical model that takes in multiple data sources on carbon dioxide to calculate a single estimated temperature trend from 1000 A.D. to 1998 A.D.
Not only did their estimates show the sharp upswing in temperature that diverged extremely from the historic record, it was relatively precise in how it moved with actual measurements of air temperature. It showed how, during the 20th century, climate temperatures grew then paused then continued to grow again starting in the late seventies.
But any model of temperature based on atmospheric carbon dioxide shouldn’t be able to predict the pause in temperature growth that happened mid-century because it wasn’t related to carbon dioxide or other greenhouse gases.
Scientists have known for some time that air pollution aerosols can have a cooling effect on the atmosphere, and the era from around 1949 to 1974 when atmospheric temperatures stopped increasing was due to particulate matter like sulfates in the air.
Before cars had catalytic converters and ran unleaded gasoline they released tons of particulate matter into the air causing smog in major cities. Smog also blocked sunlight from reaching the Earth’s surface. This caused a substantial cooling in the same way that particulate matter from volcanoes can lead to climate cooling.
When catalytic converters were mandated on motor vehicles and unleaded gasoline became the norm, smog disappeared and temperatures continued their previous ascent.
None of those mid-century fluctuations in temperature have been ascribed to changes in carbon dioxide output by humans or nature. Growth in human-originated carbon dioxide continued across those decades alongside industrial society as it did before and after the development of catalytic converters.
If Mann et. al’s model was based on ice core and tree ring data showing historic atmospheric carbon dioxide levels, there shouldn’t be any variation in the mid-20th century.
Mann Emails at Penn State
Not only should Mann’s charts not show that mid-century fluctuation in temperature, it gives more credence to accusations that Mann included temperature measurements as inputs into the model—essentially using temperature to predict temperature.
Emails at the University of East Anglia in Britain were hacked in 2009 showing a conversation between Mann then at Pennsylvania State University and others. Sometimes referred to as “Climategate,” the emails include a conversation that appears to describe someone adding temperatures into the model.
I’ve just completed Mike’s Nature trick of adding in the real temps to each series for the last 20 years (ie from 1981 onwards) and from 1961 for Keith’s to hide the decline.
Mann insisted that “no researchers in this field have ever, to our knowledge, ‘grafted the thermometer record onto’ any reconstruction.” Penn State would investigate the allegations and issue a report stating “there exists no credible evidence that Dr. Mann had or has ever engaged in, or participated in, directly or indirectly, any actions with an intent to suppress or to falsify data.” The use of temperature data was simply to create a chart that showed model predictions and then actual temperature values afterwards.
But outside of the one chart with temperature values added, Steven McIntyre, a Canadian minerals prospector and publisher of a climate skepticism site, Climate Audit, questioned whether Mann’s temperature curves were reproducible with the data that was used.
Even with reverse-engineering I’m unable to replicate the Swindlesque S-curve in the Mannian 20th century smooth (by “Swindlesque” here, I mean a curve showing a noticeable mid-century decline).
Mann, now at the University of Pennsylvania, would eventually sue the Competitive Enterprise Institute and a conservative writer, Mark Steyn, for defamation for comparing Mann to Jerry Sandusky and calling him “fraudulent” respectively.
The lawsuit, filed around a decade ago, now finally goes to trial this month.


It was never proved that the Climategate emails were hacked, or indeed leaked. The local police force, which investigated the competing claims, closed the case without reaching any conclusion as to the person(s) responsible.