Inflation Didn't Budge as Monetary Supply Grew Following Financial Crisis
A long standing economic theory states that money supply controls inflation. Otherwise known as the equation of exchange, it states that the total amount of money in the economy is equivalent to the total value of goods and services.
The implication being that with more money in the economy, producers and retailers will charge more for goods and services.
Historically, countries that handled economic struggles by printing scads of cash would see prices on goods shoot up accordingly under hyperinflation: Weimar-era Germany, post-WWII Hungary, and more recently Zimbabwe and Venezuela.
Derived by John Stuart Mill in the 1800s, the full equation is:
Total Supply of Money (M) x Velocity of Money (V) = Average Price of Goods (P) x Index of Real Value of Transactions (Q).
Or
M x V = P x Q
Two factors in the equation aren’t known—the velocity of money (V) and the index of transactions (Q). But without them it still states that the money supply is directly related to the average price of goods—i.e. the consumer price index (CPI)—which determines inflation.
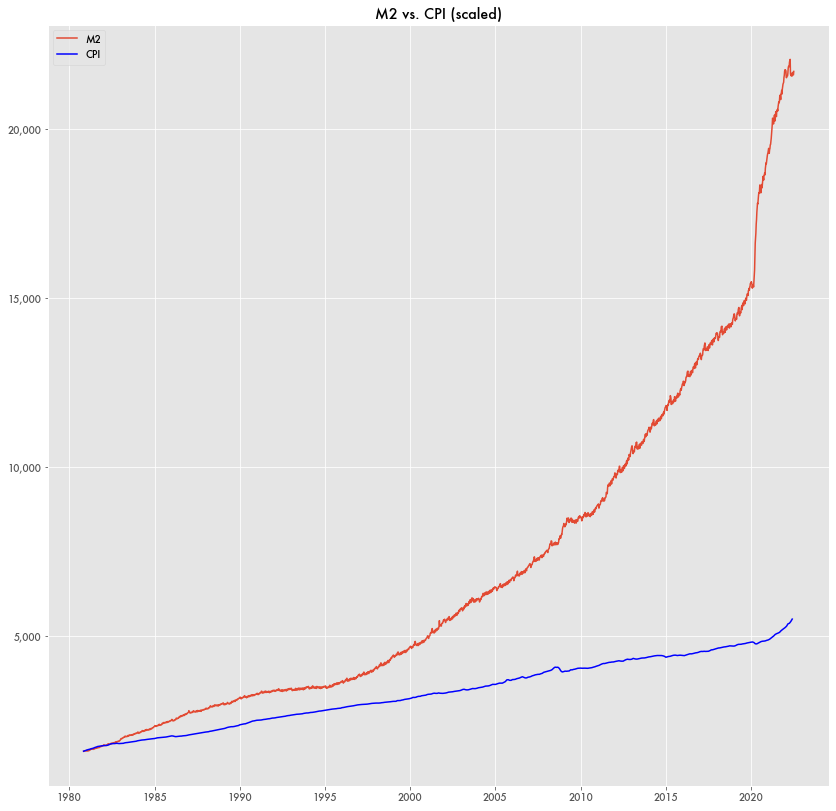
Yet, for the last twelve years in the U.S. the two values, monetary supply and the price index, have had little in common. Both have been increasing, but CPI has lagged far behind monetary supply.
The two most common measure of monetary supply are M1 and M2. M1 is the more limited measure that includes total currency in circulation along with certain types of bank deposits. M2 is M1 plus a larger class of deposits. M0—the monetary base—is simply a measure of total currency.
For M1, it diverged from inflation beginning in 2008 following the financial crisis when the Federal Reserve dramatically increased borrowing to support financial markets.
While inflation has grown substantially following pandemic spending by the government, it’s nowhere near the scale of what might be expected by the growth in M1.
While the monetary supply in the economy has grown, it hasn’t been from printing money but largely from borrowing at the federal level.
Note: the following graphics scale CPI values to be in line with M1 values beginning on September 1980 to show dispersion in the following years.
M2, on the other hand, hasn’t tracked with inflation over the last six decades. At times in the mid-nineties, CPI flatlined as the total amount of money in the economy kept soaring. That spread only got larger following the financial crisis.
It is only in the last year with the sharp turn in inflation following pandemic spending that CPI has grown at a large rate. And even then, it’s not in the same ballpark as M2.
CPI Reliability
CPI is based on survey data from the Bureau of Labor Statistics (BLS). For determining inflation, BLS only tracks costs on a select basket of goods otherwise known as core CPI, and it doesn’t include common expenditures like food and gasoline.
Personal Consumer Expenditures (PCE) is another, more general index that includes food, energy, and other goods, but it too shows little effect from the growth of monetary supply.
PCE diverged from CPI starting back in the 80s, growing about twice as fast. But it saw no real change following the monetary growth of the financial crisis. And while it has also grown during the pandemic, it’s nowhere on the same scale as that of M1 over the last two years.


