Biden Administration Trumpets GDP Numbers Driven By Massive Debt Largely From Europe
In January, the Biden White House published a press release announcing the recent highlights of the economy such as “the fastest economic growth in nearly four decades” and “the greatest year of job growth in American history.” Bills like the CARES Act helped inject cash into the economy at a dire time when it was needed the most and have generally been considered a success.
The administration has taken a victory lap and so has Modern Monetary Theory (MMT)—the economic theory that high government spending, inflation, and money creation can be justified as long as it results in high growth and added debt will eventually paid for in taxes. The New York Times recently gave a laudatory profile of economist Stephanie Kelton renown for her singular support of MMT that may have inspired the Biden administration during the crisis. MMT is highly debated in economic circles because it encourages spending without considering how it will be paid for besides creating more money.
Over the last year, gross domestic product (GDP) has grown quickly as the country recovers from the pit of the pandemic. Change in real GDP was the highest it has been on record. But that speed has solely been driven by a massive increase in debt. While measures of the available money supply, like M1, have increased substantially leading to the relatively high rates of inflation, it hasn't been from printing money.
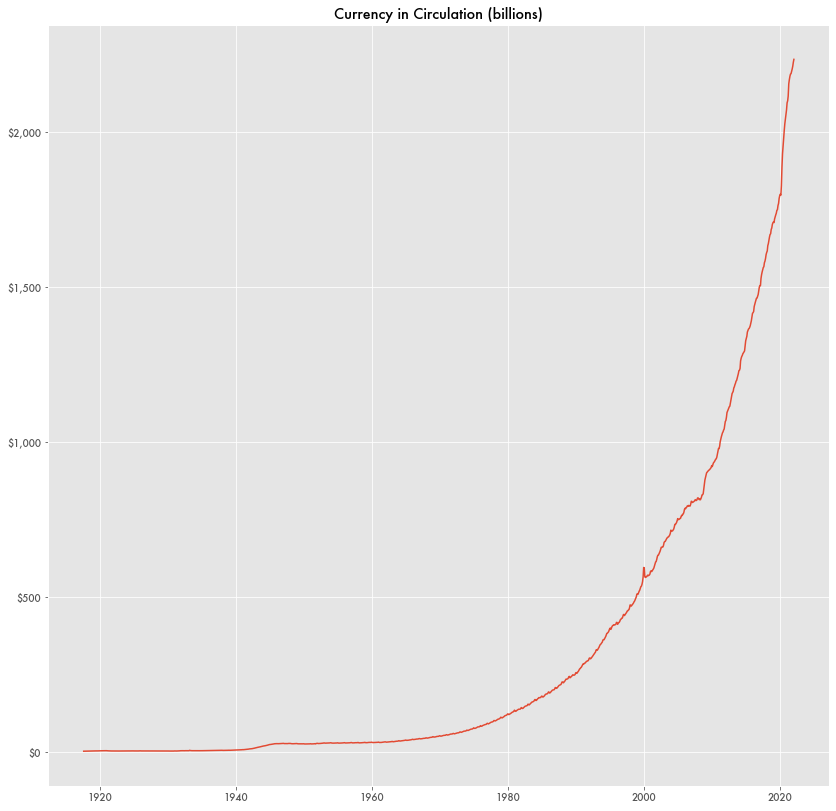
Actual cash as a percentage of M1 is at its lowest rate based on available data from Federal Reserve Economic Data (FRED). The availability of money is driven by a number of large factors besides quantities of printed cash, like how much is in circulation controlled by the Federal Reserve.
Printing of cash did increase during the pandemic, more so than in previous years, but nowhere to offset the scale of other sources in the money supply.
While growth in real GDP has been substantial, it's substantially less than the new debt that it took to create that GDP. Total debt driven by borrowing jumped from its previous highs and sits at an outstanding $28 trillion and increased by $5 trillion during the pandemic. Total public debt as a percentage of GDP jumped from 108 percent to 123 percent.
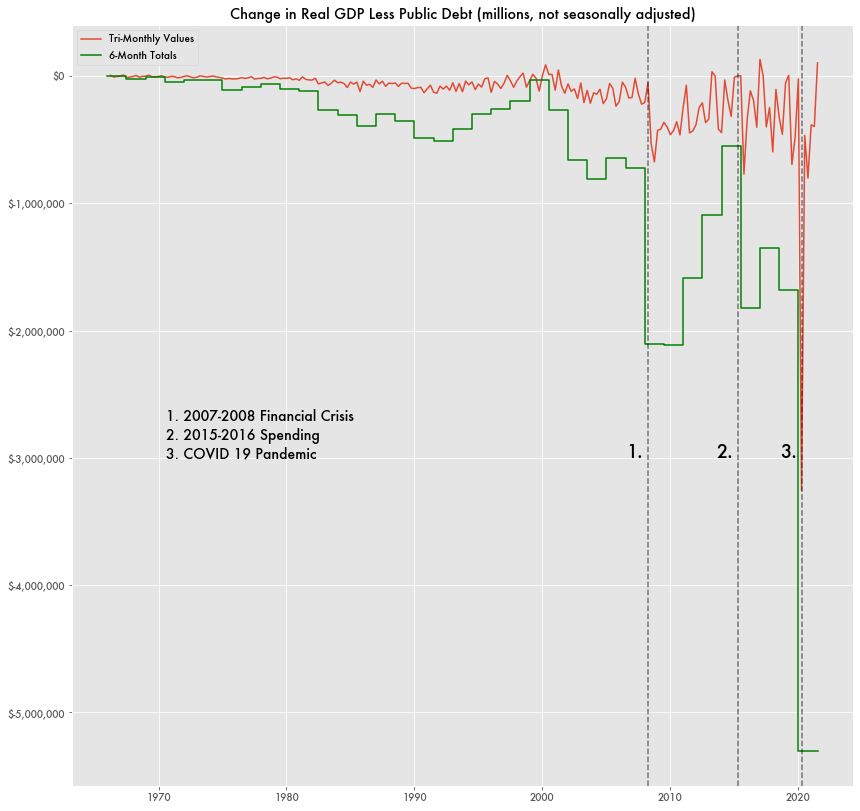
The effective net GDP—the change in real GDP minus the change in debt—is at the lowest it has ever been, and that includes massive recession periods like the 2007-2008 financial crisis and 2015 spending.
Prior to 2000, net GDP was sometimes a positive number and hovered around zero. It only eked below one trillion after the financial crisis. In the first six months of 2021 it was negative 5.3 trillion.
While Chinese holdings of U.S. debt gets a lot of attention, it was largely other countries that helped subsidize borrowing this time. Privately held long-term securities increased by about $6 trillion during the pandemic, with about half of that coming from Europe.


